

In May 2026, U.S. President Trump embarked on another visit to China, holding a historic summit in Beijing with Chinese leadership. Amidst long-standing friction in U.S.-China relations, this high-level meeting signaled an intent to "seek pragmatic, targeted cooperation amidst competition." Although sharp confrontations persist regarding intellectual property, geopolitics, and core technologies, the conceptualization of dialogue mechanisms—such as a U.S.-China trade commission—offered a glimmer of hope for tariff adjustments and the reshaping of trade flows within non-sensitive, traditional manufacturing sectors.
In recent years, China’s exports of lighting products to the U.S. have faced significant external pressure due to tariff disputes and adjustments in supply chain policies. The enduring tariff barriers and pressures to divert supply chains—prevalent during both of Trump’s terms—have forced Chinese lighting enterprises onto a path of cyclical restructuring. By examining the development of bilateral dialogue mechanisms and analyzing export data trends from recent years, we can objectively assess the industry's current state of strain and provide a reference for the structural adjustments required by lighting companies engaged in foreign trade.
I. Overview of Trends and Multifaceted Pressures: Cyclical Fluctuations in Exports to the U.S.
Between 2022 and 2025, China’s exports of lighting products to the U.S. transitioned from a period of fluctuation on a plateau to a phase of deep bottoming-out and rational correction. The prolonged nature of U.S. tariffs on Chinese goods effectively eliminated artificially inflated external demand; market demand is now realigning with the fundamental realities of U.S. domestic inventory reduction and supply chain diversification.
According to total customs export statistics:
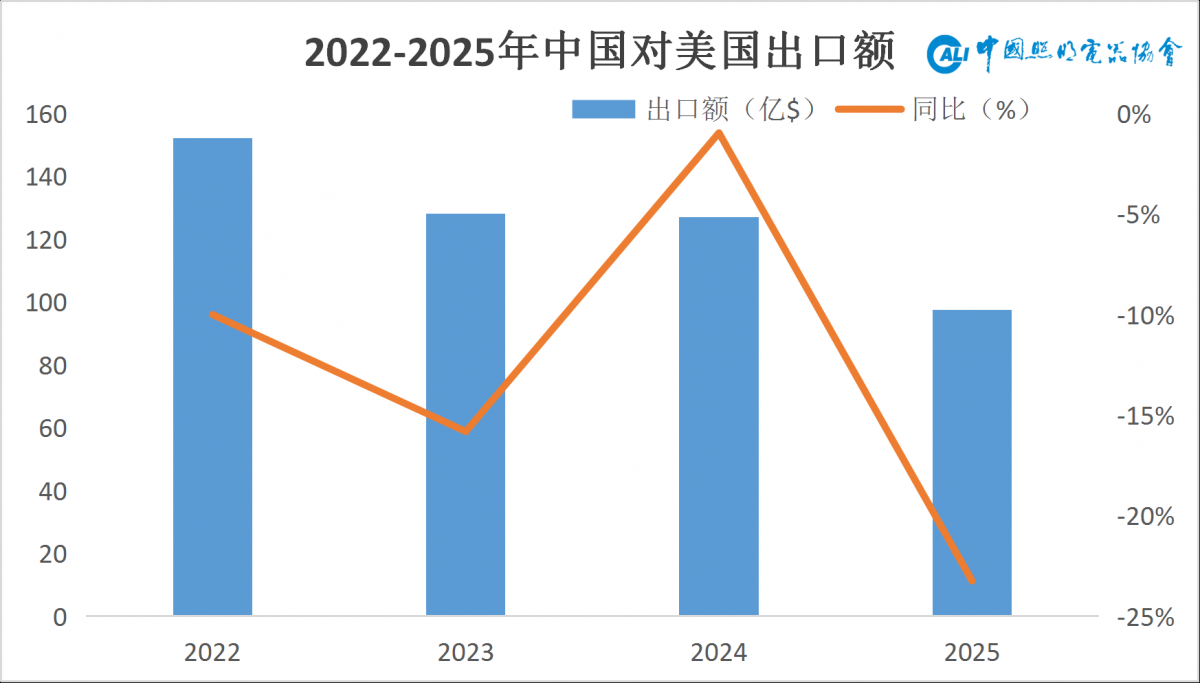
In 2022, total exports to the U.S. reached $15.225 billion, remaining at a cyclical high thanks to the lingering effects of the post-pandemic consumption recovery. In 2023, the total fell to $12.817 billion, a year-on-year decline of 15.8%. Aggressive interest rate hikes by the Federal Reserve cooled the U.S. real estate market, directly dampening end-consumer demand. In 2024, the total export value stood at $12.693 billion, a slight year-on-year decline of 0.96%, marking a brief period of stability amidst macroeconomic pressure. In 2025, as heightened uncertainty and high inflation led to a contraction in consumer purchasing power, total exports fell further to $9.743 billion—a sharp year-on-year drop of 23.2%.
Monthly Trends in 2025 and Preliminary Trends for Early 2026
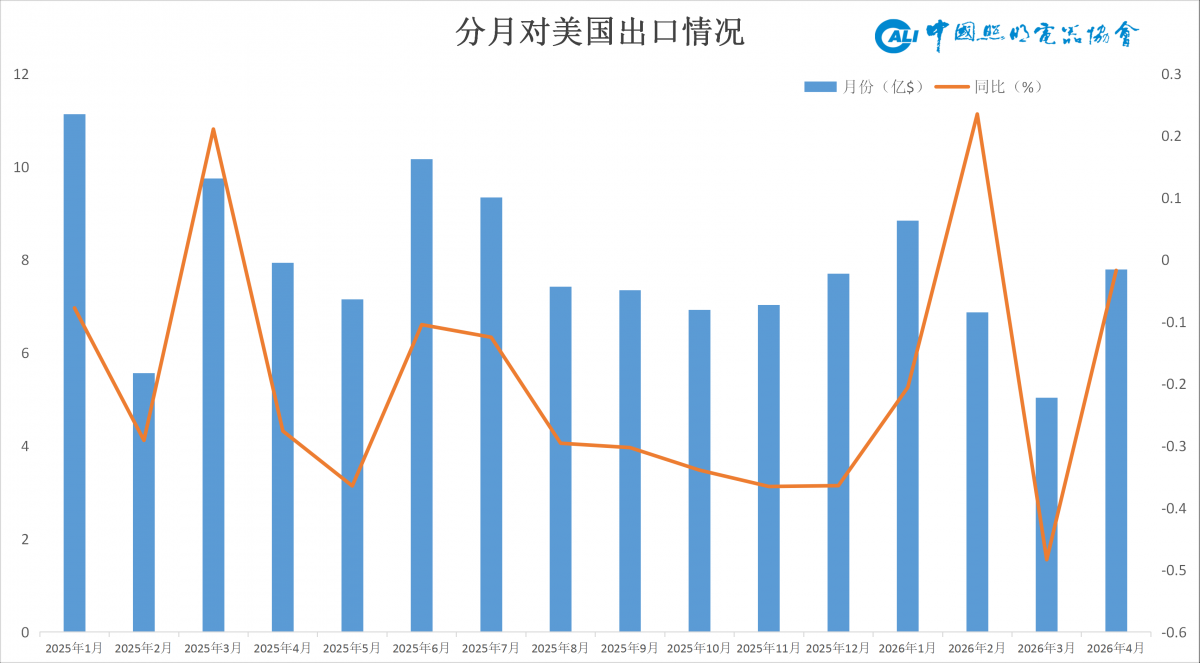
In the first half of 2025, with the exception of a "spike" rebound in March—driven by a surge in customs clearances following the Lunar New Year holiday—most months saw double-digit declines. Specifically, year-on-year drops reached 29.1% in February, 27.6% in April, and 36.5% in May. In the second half of the year, the year-on-year decline stabilized within the -30% to -36% range.
Entering 2026, geopolitical conflicts dealt a direct blow to global logistics.
In January, exports totaled $884 million, a year-on-year decrease of 20.6%, continuing the sluggish trend. In February, exports rose 23.5% year-on-year to $687 million; anticipating a future surge in ocean freight rates due to the sudden escalation of tensions in the Middle East, foreign trade enterprises rushed to ship goods early. In March, exports fell 48.4% year-on-year to $503 million. As the US-Iran war broke out in full force, Iran closed the Strait of Hormuz and Brent crude prices soared past $120 per barrel; global maritime logistics were severely paralyzed, causing exports to the US to plummet by nearly half. In April, exports totaled $779 million, a year-on-year decline of just 1.7%. As supply chain logistics began implementing emergency rerouting, the rate of decline narrowed significantly, demonstrating the remarkable resilience and recovery capacity of China's lighting industry chain. II. Provincial Performance in 2025: Coastal Concentration and Regional Anomalies
Amidst the overall adjustment in exports to the U.S., traditional coastal provinces known for lighting manufacturing—while seeing a decline in total volume—maintained their absolute dominance. Conversely, certain central-western and border provinces exhibited distinct counter-trend growth, driven by specific cross-border e-commerce structures, transshipment via bonded zones, or policy incentives.
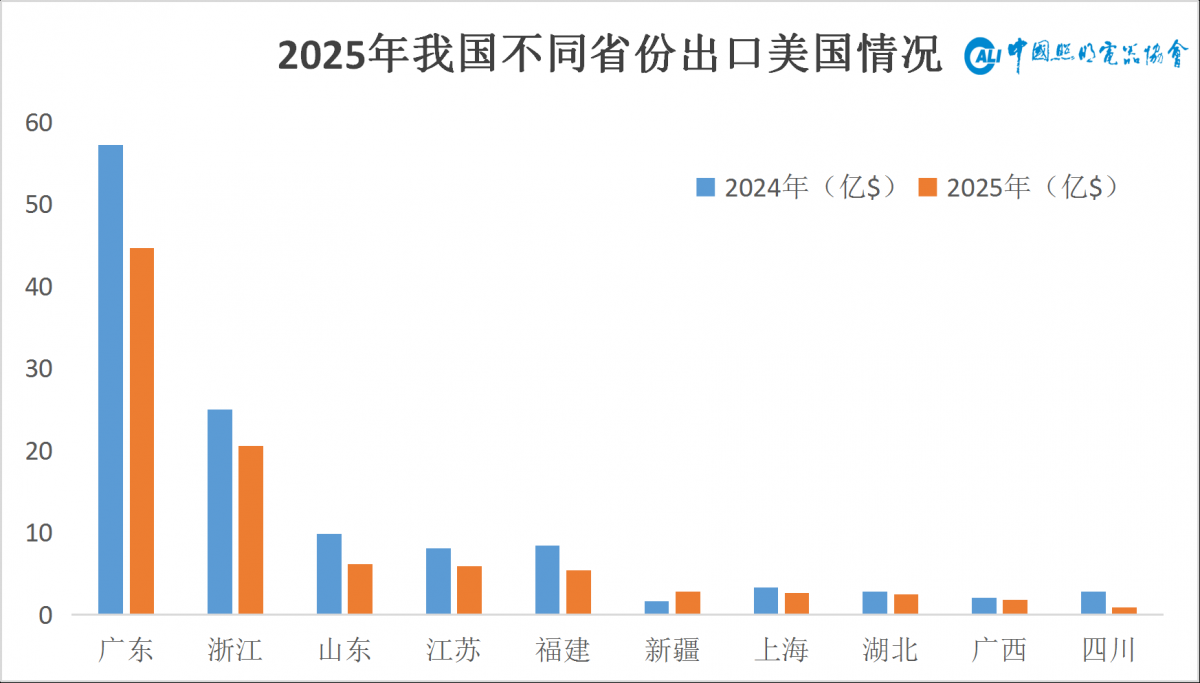
In terms of provincial rankings, Guangdong Province (with exports of $4.463 billion) and Zhejiang Province (with exports of $2.056 billion) formed a "first tier" that stood far ahead of the rest; together, they accounted for more than half of the nation's total exports to the U.S.
However, impacted by U.S. tariffs and real estate cycles, the top five coastal provinces all recorded double-digit declines: Guangdong fell by 21.9% year-on-year, Zhejiang by 17.7%, Shandong by 37.3%, Jiangsu by 27.6%, and Fujian by 35.8%.
In contrast, some regions achieved counter-trend growth, albeit from a low base: Hainan Province’s exports reached $17.72 million (up 2,139.6% year-on-year), and Gansu Province’s exports hit $2.39 million (up 837.9%). Additionally, Xinjiang (up 74.8%), Inner Mongolia (up 81.9%), and Shanxi (up 196.1%) also posted counter-trend gains from low starting points.
III. Analysis by Product Category: "Downgrade Substitution" and Competition for Existing Market Share
1. Electric Light Sources: Accelerated Phase-out of Traditional Sources; Resilience of Specialty Sources
Market demand for traditional incandescent and fluorescent lamps continued to shrink. Meanwhile, high-value-added specialty light sources (for scientific research and medical use) and green, energy-efficient UV/IR light sources demonstrated strong resilience against economic cycles within the existing market. In 2025, the total export value of the electric light source category stood at $1.098 billion, a year-on-year decline of 21.8%. Within this segment, "other" incandescent bulbs fell by 31.4%, while incandescent bulbs for scientific or medical use experienced a precipitous drop of 83.3%. Exports of LED bulbs and LED tubes—the category's core products—amounted to $594 million and $230 million respectively, representing year-on-year declines of 24.1% and 20.3%.
Conversely, high-barrier product categories bucked the trend and grew: halogen-tungsten lamps for scientific and medical use rose by 18.7%, those for trains, aircraft, and ships increased by 24.2%, and other discharge lamps for scientific and medical use surged by 101.2%.
2. Luminaires: Significant decline in project and commercial demand; decorative lighting shows polarized trends
The downturn in the real estate and commercial/industrial construction markets severely dragged down exports of fixed architectural and project-based luminaires. In contrast, light strings (driven by inelastic holiday demand) and consumer-grade portable lights saw relatively moderate declines, reflecting a shift in the North American end-consumer market from "major investments in home fixtures" to "small-ticket experiential purchases."
The total value of the luminaire category reached $7.059 billion in 2025, down 25.5% year-on-year. Project-based and traditional commercial luminaires faced the greatest downward pressure: "other" chandeliers and electric lighting fittings for ceilings or walls plummeted by 41.8%, while "other" electric table, bedside, or floor lamps dropped by 44.0%. Although non-photovoltaic LED lamps and lighting fittings—a flagship export segment—recorded a substantial total value of $2.172 billion, they still suffered a 15.0% year-on-year decline.
Meanwhile, LED light strings for Christmas trees fell by 39.8% amid immense inventory-clearing pressure; however, non-photovoltaic LED searchlights and spotlights bucked the trend with a slight increase of 0.5%, demonstrating that demand for specific outdoor and security applications remains inelastic. 3. Other Non-Primary Lighting Products: Automotive Components Demonstrate Industrial Resilience
The total value for this category in 2025 stood at $1.585 billion, a year-on-year decline of 12.5%—a relatively moderate drop. Driven by profound transformations in the global automotive supply chain and a robust US market for replacement parts for both new and used vehicles, exports of automotive lighting and electrical signaling devices totaled $682 million. This represented a slight decline of only 6.8%, demonstrating unique resilience amidst an overall market downturn.
IV. Macro Analysis and Future Outlook: Opportunities Amidst Challenges and Multi-Dimensional Breakthroughs
1. Monetary and Interest Rate Cycles: Forward-Looking Positioning to Mitigate Volatility
Conflicts have triggered global energy inflation and a surge in commodity prices, disrupting expectations for interest rate cuts and fueling calls for the Federal Reserve to resume rate hikes in the second half of the year. High interest rates will continue to suppress the US real estate market, effectively lowering the ceiling for total export volumes. Meanwhile, soaring ocean freight rates and rising raw material costs will completely offset any benefits derived from exchange rate fluctuations.
2. The Surging AI Wave: Evolving Toward AI-Powered, IoT-Enabled Smart Lighting
The global AI wave is rapidly extending to edge devices, making the integration of "AI + Lighting" a key breakthrough for overcoming tariff barriers and increasing average order values. Companies can embed chips with low-power AI edge computing capabilities, as well as vision or radar sensors, into lighting fixtures to enable foot-traffic tracking and adaptive energy management. Alternatively, they can utilize AI algorithms to implement dynamic dimming for horticultural lighting and full-spectrum, health-centric lighting solutions.
3. Upgrading Export Compliance: Fortifying "Invisible Trenches" in Green Standards and Cross-Border Trade
US-China competition is evolving into "invisible" technical barriers centered on supply chain compliance and carbon footprint tracking. As major corporate buyers begin to mandate full-lifecycle carbon footprint reports, Chinese enterprises must accelerate the transformation of their facilities into green factories. V. Conclusion
Looking at the trajectory of China’s lighting product exports to the U.S. from 2022 to 2026, the industry is moving away from a growth model reliant on low prices and sheer volume. Despite significant growing pains, aggregate data indicates that the market has begun to bottom out following a period of deep adjustment; the rapid narrowing of volatility in April further underscores the irreplaceable resilience of my country’s lighting manufacturing supply chain.
Future competition in a saturated market will increasingly test comprehensive capabilities. Only by abandoning reliance on low pricing—and instead shifting focus toward AI-driven smart innovation, expansion into high-barrier sectors such as industrial and medical lighting, and the establishment of deeply compliant global supply chains—can Chinese lighting exporters truly elevate "Made in China" to the level of irreplaceable "Smart Manufacturing in China," ensuring steady and enduring progress amidst the turbulent currents of the international market.
